

Every August, on the eve of Independence Day, the Cabinet Division announces the year’s Pakistan Civil Awards. The following March, on Pakistan Day, they are conferred. In between, the lists circulate in the media for a day or two, read name by name, and then they pass out of view. Each announcement is accompanied by a document, complete in itself but rarely looked at again.
Placed one after another, nine of these documents become something a single one can never be: a dataset. The awards from 2018 through 2026 amount to 2,209 individual recognitions. Coded consistently, recipient by recipient, along a few dimensions, they can be counted, sorted and compared. What follows is a description of the patterns that emerge from that exercise. None of it is a claim about intention or cause. Rather, the aim is to set out what becomes visible once a public record is assembled into a structured whole, and to leave the interpretation, for the most part, open.
The first thing the series reveals is its own scale. The annual lists run from 73 names in 2018 to 372 in 2026, and the path rises and falls: 73, 116, 185, 125, 255, a large 416 in 2023, a sharply smaller 105 in 2024, then 263 and 372. The 2023 total sets aside a separate, one-time group of 299 health workers recognised after the pandemic, kept apart throughout this analysis so that a single extraordinary event does not distort the underlying trend.
Against that shifting volume, the useful questions concern what stays constant and what moves. As the lists expanded, the plurality category in any given year changed hands repeatedly, from engineering in 2021, to arts and culture in 2022, to public service across 2023 to 2025, to gallantry in 2026. The pie did not simply grow. Its slices were recut, year by year.
Of everything the data holds, the most stable number is the share of awards going to women, and it is stable in a way that merits a closer look.
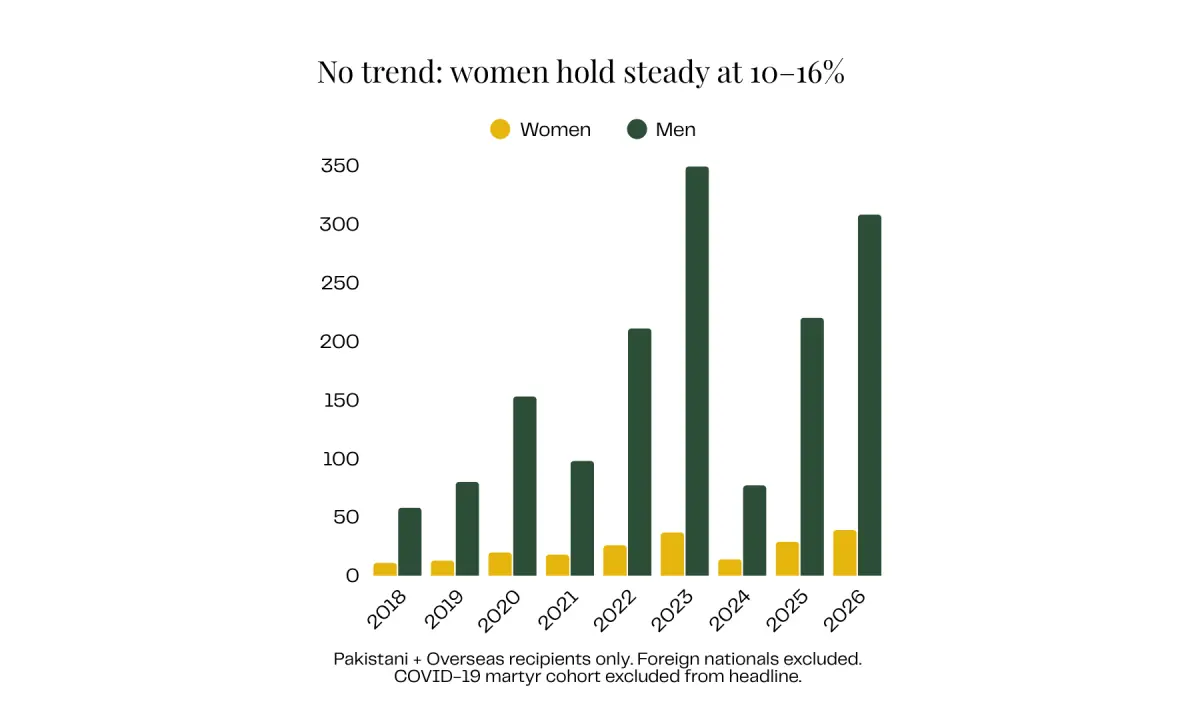
Counting only Pakistani and overseas-Pakistani recipients, so that foreign honorees do not distort the picture, women make up between roughly 10 and 16 per cent of recipients in every single year from 2018 to 2026. The proportion does not trend upward or downward across the nine years—it holds. This is notable because the lists themselves change size so dramatically. The 2023 list was more than five times the length of the 2024 list, yet the female share barely differed between them. A number that steady, across lists of such different sizes, is itself a finding worth pausing on.
One natural thought is that gallantry awards, which tend to follow military and police service, might be doing the work. Setting them aside entirely, the pooled female share across all nine years rises only from about 12pc to 14pc. Therefore, the pattern is not the artifact of one category. It runs through the civilian awards as well.
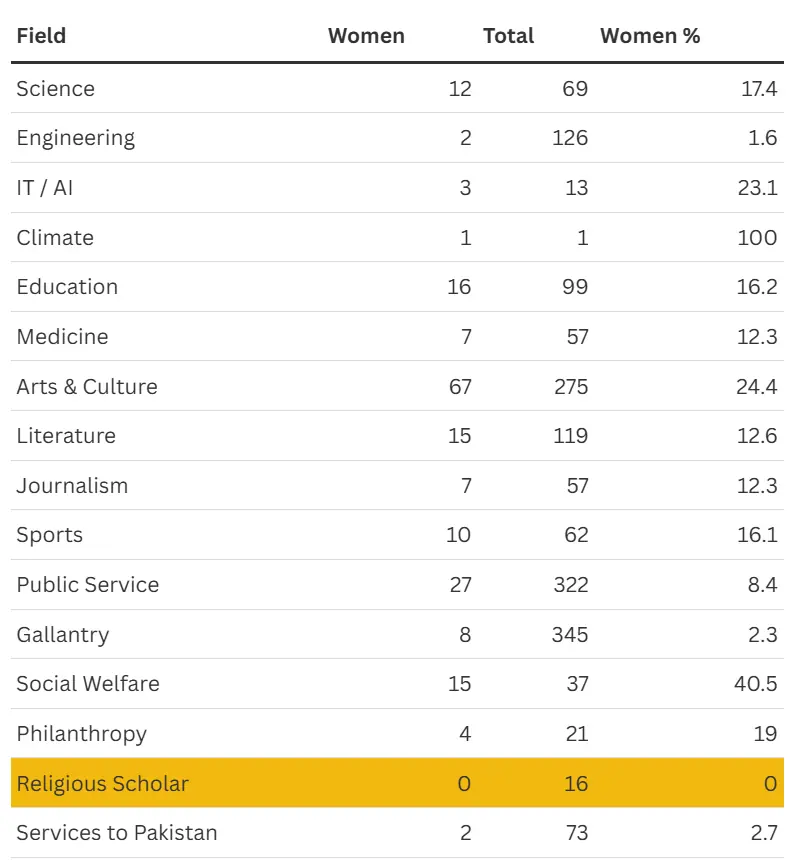
Yet that single figure of roughly 12pc is, on inspection, not one number but an average of very different ones. Pooling all nine years and looking inside each field, the range is wide. In engineering, women received two of 126 awards. In gallantry, eight of 345. Move to other domains and the picture inverts: in social welfare, women take about 40pc of awards, in arts and culture close to a quarter, with education, science, sport and information technology sitting in the high teens to low twenties. The headline share, in other words, conceals a strong field structure, a near-absence in some areas and a substantial presence in others, averaging out to something that looks unremarkable and hides the variation entirely. Which fields, one might ask, would move first if that overall figure ever did shift?
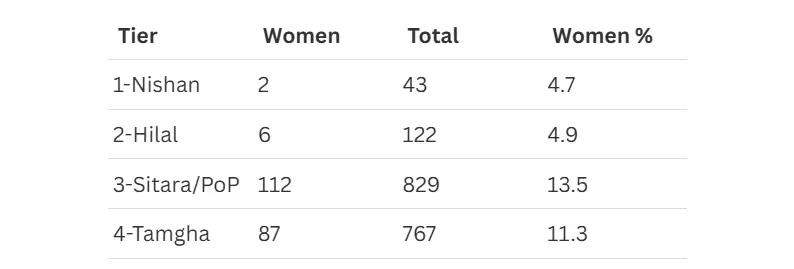
The variation does not stop here. Sorting the awards by seniority reveals a second trend. The honours run in tiers, from Nishan and Hilal awards at the most senior end, through Sitara-e-Imtiaz and the President’s Award for Pride of Performance, down to the more numerous Tamgha-e-Imtiaz. Arranged this way, the female share falls as the awards become more senior. At the two highest tiers it sits below 5pc; at the lower, more numerous tiers it runs between roughly 11 and 14pc. The same overall figure, once again, looks different depending on where in the hierarchy one looks.
The single largest civilian category makes the point most concretely. Public Service accounts for more awards than almost any other field across these years, which is exactly why its composition is worth isolating. Of the Public Service awards going to Pakistani recipients over the nine years, 294 went to men and 28 went to women, roughly 91pc against nine. In several individual years, the entire Public Service list contained only one or two women. As the category expanded, sometimes sharply, that split held largely constant. While the size of the category moved a great deal, its composition did not.
A structural fact belongs alongside this, offered as context the reader can weigh rather than as an explanation. The recruitment framework for the federal civil service prescribes a quota of around 10pc for women. The share of Public Service awards sits below even that figure. Whether the awards reflect the existing composition of the services or are specific to the awards themselves is precisely the kind of question the data raises without settling.
If gender is one lens the compiled record opens up, the mix of fields is another, and it moves in ways no single year’s list could show.
Consider science and engineering together. In 2021, the two accounted for 31pc of that year’s list, close to a third of it. The share then falls year on year, to 14pc in 2022 and 12 percent in 2023, before dropping to 4pc in 2024, 1pc in 2025 and 2pc in 2026. This is among the most pronounced movements in the entire dataset. The years in which science and engineering loomed largest were dense with the country’s technical and applied establishment; the more recent lists are not. What might sit behind a shift of that size? Fewer landmark contributions being put forward from those fields, fewer people entering them, or a change in where recognition is being directed? The data marks the movement clearly; it does not adjudicate the reason.
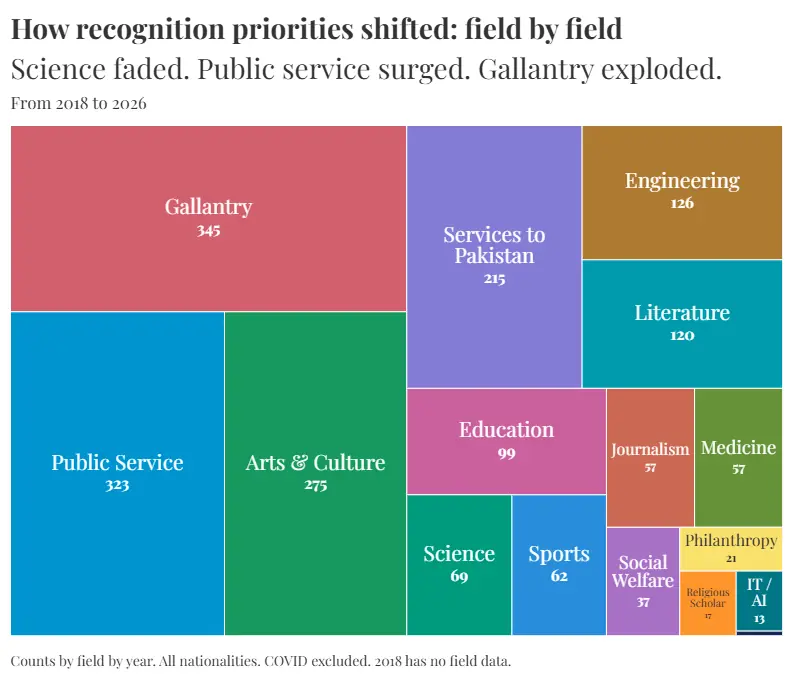
Technology, kept separate from engineering, tells a smaller but pointed story of its own. Information technology appears as a distinct category for the first time in 2021. Climate, as its own field, appears for the first time in 2025. These are new entries in a record that had not carried them before, and they raise a gentler question: is recognition beginning to track where a country’s talent and attention are actually moving?
Medicine and health form a third thread, and here the pandemic is visible in the numbers. Medical recognitions were almost nominal in the earlier years, with a single medical awardee in 2019 and again in 2020 and none in 2021, then rose sharply to 11 in 2022 and 19 in 2023, quite apart from the separate 299-person health cohort set aside earlier. After easing to five in each of 2024 and 2025, the figure climbs again to 15 in 2026. Education remains a steady and substantial presence throughout. Arts and culture, taken as a single broad domain spanning acting, music, painting, calligraphy, craft and performance, is consistently one of the largest civilian categories in the entire series, and, as already noted, one of the few in which women appear in real numbers.
A further cut looks only at the most senior honors, Nishan and Hilal tiers, and asks which fields their recipients come from.
Among Pakistani recipients, the answer leans heavily toward a small set of categories. At the Nishan level, Public Service accounts for 37pc of names and Literature for a further 28pc, so the two together make up close to two-thirds of the most senior tier, with arts and culture adding another 14pc. At the Hilal level, Public Service again leads at 34pc, ahead of gallantry at 12pc and education at 9pc. This concentration is worth stating carefully. It very likely reflects how nominations for the most senior awards are structured and routed in the first place, rather than any judgment that can be read directly off the outcome. The composition of the top tier is probably an artifact of the recommendation process that feeds it, and the data can show the pattern without speaking to the process behind it.
The announcements are not uniform in what they record. Some years list a recipient’s field but not their province; others do the reverse. Province is recorded cleanly and consistently in four years, 2019, 2020, 2021 and 2024, and the geographic cut that follows covers those years alone rather than the full run.
Across those four years of the domestic recipients whose province is recorded, Punjab accounts for 43pc, Sindh for 22pc and Khyber Pakhtunkhwa for 21pc. The remaining share is split between Balochistan and Gilgit-Baltistan at roughly 5pc each, Islamabad at 3pc and Azad Jammu and Kashmir at 2pc. One field shapes this picture more than any other: gallantry awards, in these years, are concentrated most heavily in Khyber Pakhtunkhwa. Because gallantry can make up a large share of a year’s list, a province’s overall count is shaped in part by which categories happened to be large that year, so the provincial figures are best read alongside the field mix rather than on their own.
A posthumous award is one conferred after the recipient has died, recognizing a life’s work or a final act once the person is no longer present to receive it. The share of awards conferred this way varies considerably across the series, though the earliest year requires a caveat before the figures can be compared. The source used for 2018 is the investiture record, which lists the collector rather than the recipient, and on that list, 41pc of awards were received by someone other than the awardee. Many are relatives accepting on behalf of a person who had died, but the same record cannot distinguish those cases from awards collected on someone’s behalf for other reasons, such as ill health, immobility, or absence abroad. Because the later years are not recorded this way, 2018 is best read on its own rather than against them. Setting it aside, the share conferred posthumously across the announcement years falls to 9pc in 2019 and 10pc in 2021, sits at 23pc in 2020, 13pc in 2022 and 8pc in 2023, and rises again to 19pc in 2024, 21pc in 2025 and 16pc in 2026.
The pattern invites a question that deserves to be asked gently, because it touches directly on loss. When someone is recognized after they have died, the contribution being honored was made while they were alive. What, then, determines whether recognition arrives within a person’s lifetime or only afterward? For gallantry, the answer is often bound up with the nature of the act itself. In other fields it is less immediately clear, and the data can only show the timing, never the reason behind it.
Foreign nationals, excluded throughout from the gender and domestic analysis, form a distinct bloc of their own, 149 recipients across the nine years, clustered in the senior “Services to Pakistan” honors, with the countries represented shifting across the years in step with Pakistan’s diplomatic and economic relationships. Each of these is a thread the compiled data makes available, and each could be pulled further.
None of the information here was ever hidden. Each list was published, in full, on its appointed day. What did not previously exist was the compiled form: nine documents standing together, coded the same way, so that they could be counted and compared. Every pattern set out above, the flat female share and the field structure beneath it, the tier gradient, the 295-to-27 split in Public Service, the decline of science and engineering as a share and the arrival of new categories, the geographic concentration, comes not from any new source but from the simple act of assembling what was already public.
That is what turning a record into data makes possible. A single document tells you very little on its own. A series, coded carefully, lets you ask whether something is a trend or a one-off, whether a headline figure hides internal variation, whether two things that feel connected actually move together. These are questions of pattern, and patterns live at the level of the dataset.
Finally, the questions worth leaving open, for anyone who thinks about how a country recognizes merit. If the share of recognition going to science and engineering has fallen this far, what lies behind it? If new fields such as information technology and climate are appearing for the first time, is the honors system beginning to follow where the country’s talent is heading? If the female share has remained flat across lists of such different sizes for this long, what would move it, and which fields or tiers would move first? And if the most senior awards concentrate in a handful of categories, how much of that traces to the structure of nomination rather than to anything visible in the result?
The awards are announced every August. Compiled across years and read as data, they hold a good deal more than any single announcement can show.
The dataset covers the civil award announcements from 2018 through 2026, comprising 2,209 recipients. Gender was coded from honorifics and given names, and foreign nationals were not gender-coded; for a small number of unisex or initials-only names, judgment calls were made and can be revisited. Fields were grouped into consistent categories, with science and engineering, medicine and health, and arts and culture each treated as broad domains; these groupings involve choices that others might draw differently.
Two limits deserve emphasis. First, the 2018 announcement was structured differently from the rest: it records recipients but not their field in the form the later lists use, so it sits in the volume and gender series but not in the field-composition analysis, and any statement about the field mix begins in 2019. Second, province is recorded cleanly only in some years, so the geographic cut covers those years alone and should not be read as describing the full nine-year run. The 299-person pandemic health cohort of 2023 is treated throughout as a separate, one-time category and excluded from the headline figures. Percentages in the smaller fields rest on small numbers, and counts are given alongside them so they can be read with that in mind.

No comments yet. Be the first to comment!

Your trusted source for breaking news, in-depth analysis, and comprehensive coverage of today's most important stories.
Get daily updates on breaking news, exclusive interviews, and special features delivered to your inbox.
Have a news tip or want to get in touch with our editorial team? We're here to help.
Plot C3-C Jaypee Wishtown Sector 129 Noida Uttar Pradesh 201304 India